Facebook
 Twitter
Counting Informed Public:
Case of Spending and Taxation in Korea1
“We need to think about the meaning of genuine communication….”
President Park Geun-hye2
Domestic appraisal of President Park Geun-hye’s first year has largely focused on her ability to engage and communicate with the general public.3 In fact, the “meaning of genuine communication” has become so central to her administration’s policy that she announced an initiative to disclose more information (i.e. 100 million government document files) than ever before only four months into her presidency. The scale and scope of this undertaking, also referred to as “Gov 3.0,” is certainly ambitious; however, the key to the success of this policy rests on the administration’s ability to translate complex bureaucracy speak to average voter language. This is perhaps nowhere better illustrated than in the area of fiscal policymaking.
The Korean National Assembly began the New Year with the approval of a budget for 2014 amounting to KRW355.8 trillion, which is KRW1.9 trillion lower than the amount requested by the administration yet 2 percent higher than that of the previous year. While leading economic forecasts suggest greener outlook for the Korean economy in 2014-2015 with projected growth at about 3.4-3.8 percent (up from 2.4-2.8 percent for 2013), an expected rise in the deficit for the coming year at about 2 percent of GDP coupled with mounting private and public debt have somewhat hindered President Park Geun-hye’s ability to deliver on her promise of expanded social welfare (+KRW130 trillion or US$121 billion) without introduction of new taxes.4 Cracks are already beginning to show in the administration’s fiscal plan with the recent passage of the Tax Revision Act of 2013, which seeks to impose a heavier burden on the high income earners (more than KRW70 million per year) and large corporations.
The administration could have softened the blow from the disappointment of a broken campaign promise with effective communication and better information sharing. We base this claim on our most recent poll results,5 which show that the general Korean public, similar to that of other advanced democracies (i.e. the US, Australia, Europe), tends to prefer a combination of higher spending and lower tax. The evidence also suggests that this orientation is driven in part by the perceived underestimation of gains from government services as well as a lack of adequate understanding about the cost that the government incurs in providing these goods. Better informed public would not only have better coped with the fiscal realities but even hinted a more optimal spending priority for the coming year.
Survey Says
General wisdom about government taxation and spending is that the public always prefers more for less if and when they are asked to voice their opinion.6 Korea is not an exception to this rule. Our most recent survey, for instance, shows that an overwhelming majority of the respondents (84.5%) see their individual tax burden as being excessive or just about right with more than half of this group (45.1%) thinking that it is excessive (See Figure 1). Those in their peak earning years (30s and 40s) are most likely to say that their tax rate is high (56%). Women are also more likely than men to perceive a higher tax burden. We also found some interesting disparities across different regions. For instance, people residing in Inchon/Kyung-Gi-Do (51%), Kwangju/Jeolla-Do (47.6%), and Daejon/Choong-Chung-Do (46.3%) are more likely to say that their tax is high in comparison to those in Seoul (42.5%).
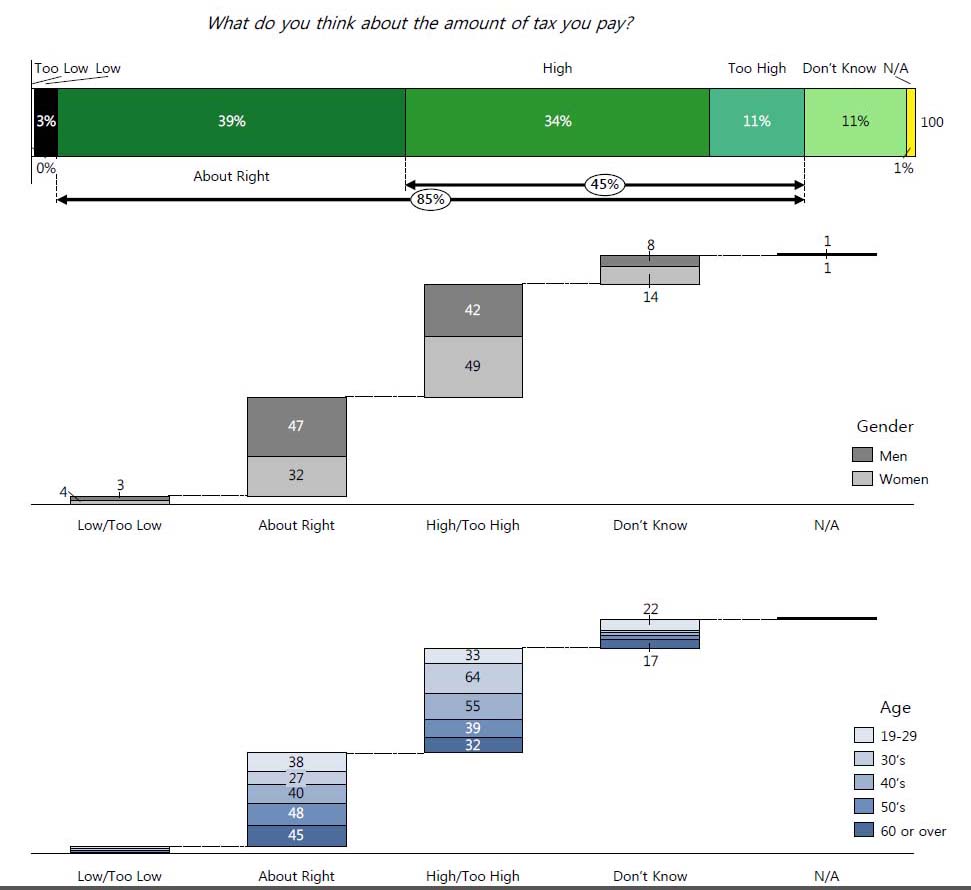
Figure 1: Korean Public Attitude on Taxation
As a follow up, we also asked the respondents to tell us what they think is an appropriate level of taxation. 23 percent responded less than 6 percent of total income and 26 percent saying anywhere between 6 percent and less than 15 percent of their income (See Figure 2). Our calculation of the average desired tax rate for the full sampled respondents came out to be about 11 percent. Interestingly, those earning less than or equal to KRW3 million per month generally preferred a tax rate below 6 percent while those in the middle (greater than KRW3 to 5 million per month) to high (greater than KRW5 million) earning categories were more tolerant of a rate in the range of 6-15 percent. Not surprisingly, self-employed, homestay, and blue collar workers favored a rate of less than 6 percent while those unemployed or in agriculture and white collar sectors were more tolerant of a higher rate of 6-15 percent. Finally, similar to the findings from the previous question, men tended to prefer (32.1%) the higher rate of 6-15 percent while more women (23.5%) favored the lower percentage of less than 6 percent.
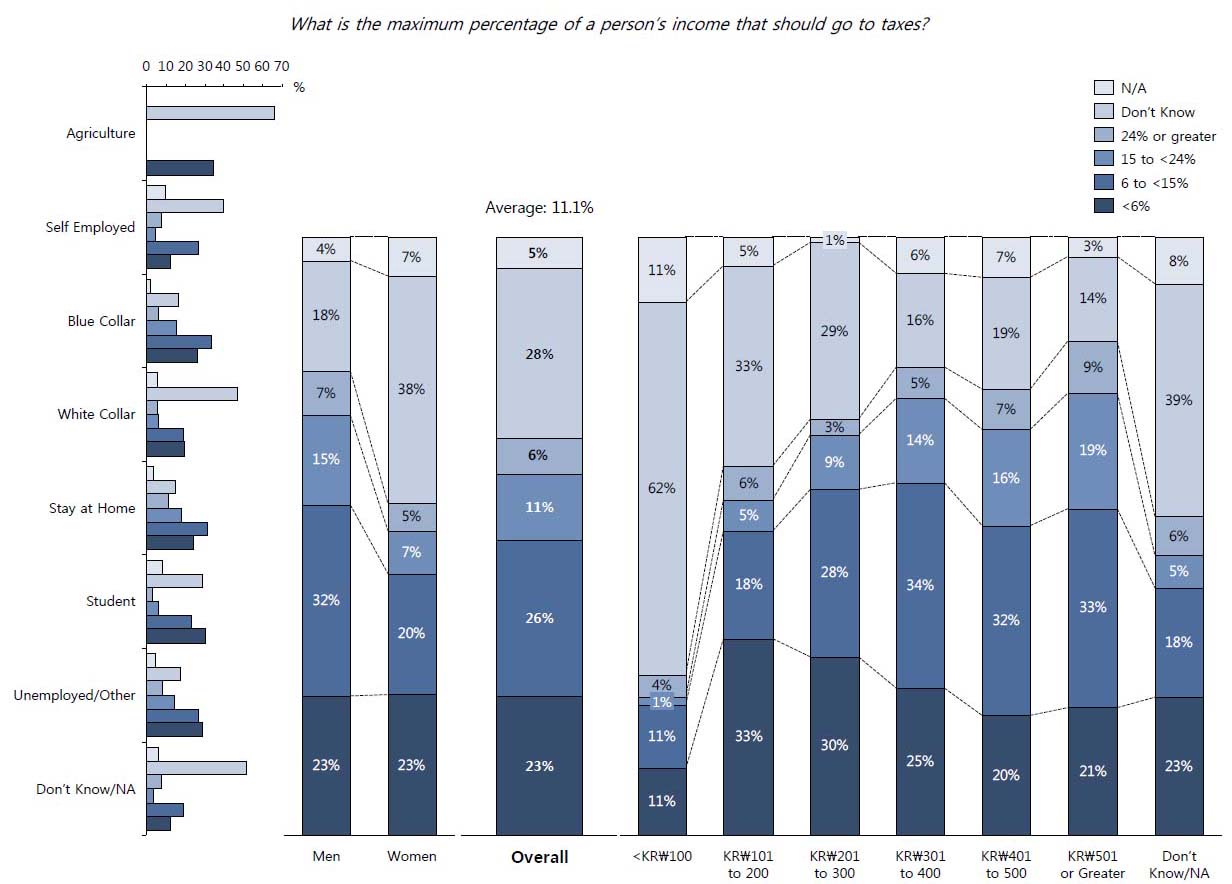
Figure 2: Korean Public on Maximum Tax Rate
When compared to the actual tax schedule, these expectations about the maximum rate of taxation is somewhat removed from reality. Korea maintains a progressive tax schedule.7 Based on the latest data from the Korean Statistical Information Service, the average annual household income is about KRW46.8 million which would make the average tax rate to be 25 percent. Note that this is much higher than the surveyed acceptable rate of 6-15 percent.
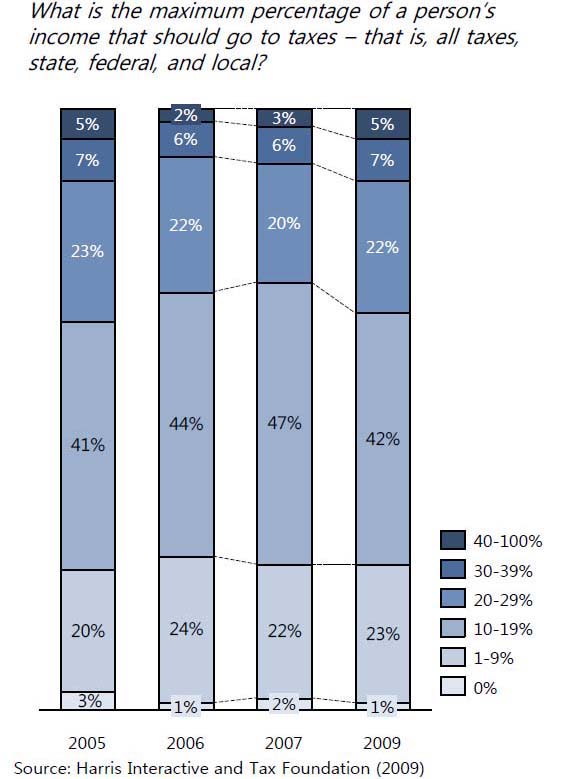
Figure 3: Maximum Tax Rate in the US
Demand for lower tax is hardly unique to South Korea. A similar set of questions in the United States has yielded results that are similar to what we found in South Korea. For instance, when asked about the most favored range of maximum taxation in the US, respondents consistently answered 10-19 percent (See Figure 3). Like Korea, this figure is much lower than the actual US national average of about 28.2 percent. When asked about the people’s opinion on the amount of federal income tax, over 90 percent of the people consistently responded that their tax is too high or just about right (See Figure 4).
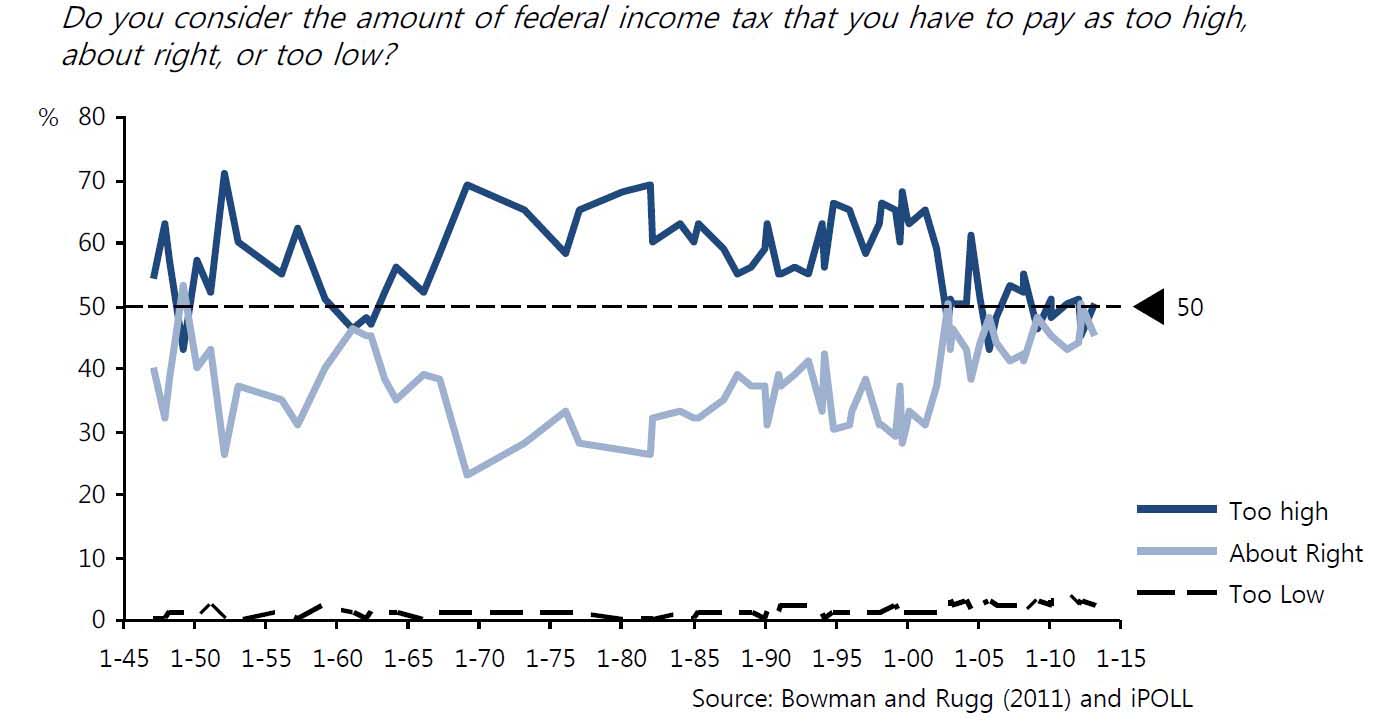
Figure 4: Attitudes on Income Tax in the US, 1947-2013
When questions are framed to point out the “price effects” by having the respondents choose whether they prefer higher taxes and increased spending or lower taxes and decreased spending, the response pattern favor neither of these options as in Europe. It is striking that this trend is prominent in Europe where taxation and government spending has generally been larger than in the US (See Figure 5).
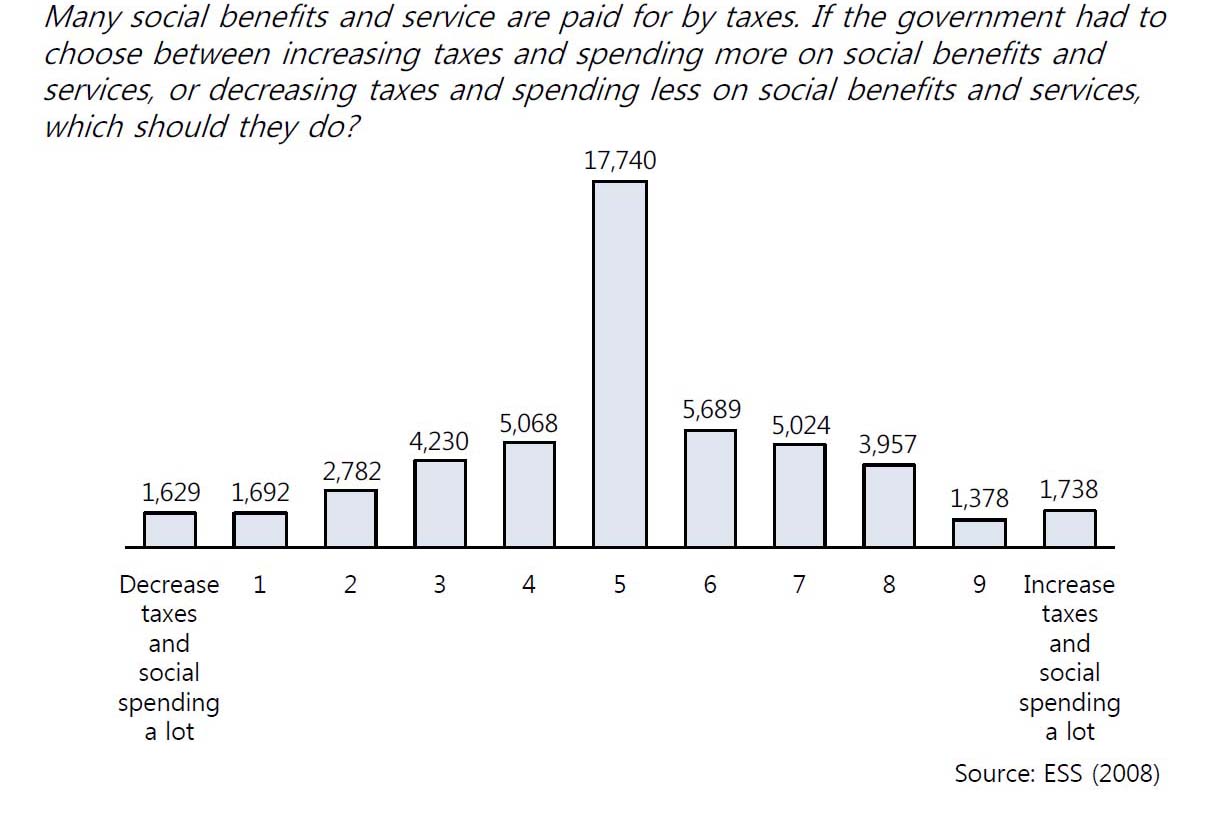
Figure 5: Taxation and Spending in Europe, 2008
If the respondents are pushed to choose between high and low tax/spending (without the status quo option), they seem to prefer the latter as in Australia.8 When we posed a similar choice in South Korea, we attained a response that corresponds to the above patterns with about 52 percent responding that they are not willing to tolerate additional tax to fund social welfare.9 What is striking about the comparative finding is that public opinion toward taxation and government spending has remained quite stable over time and universal across different societal settings.
What the Public Thinks They Got
Obviously, the finding we have discussed above does not necessarily imply tolerance for lower spending. Take for instance our questions on the public’s perception of government spending in various areas (See Figure 6). There are two important take away points with regards to this data. First, a significant number of respondents do not seem to know enough about various areas of spending to express a strong opinion about them. Secondly, of those that did express an opinion, most thought that the government spending in all areas, except for culture and sports, were inadequate. It is important to note that these feelings do not seem sensitive to the level of spending in each category (See Figure 7).
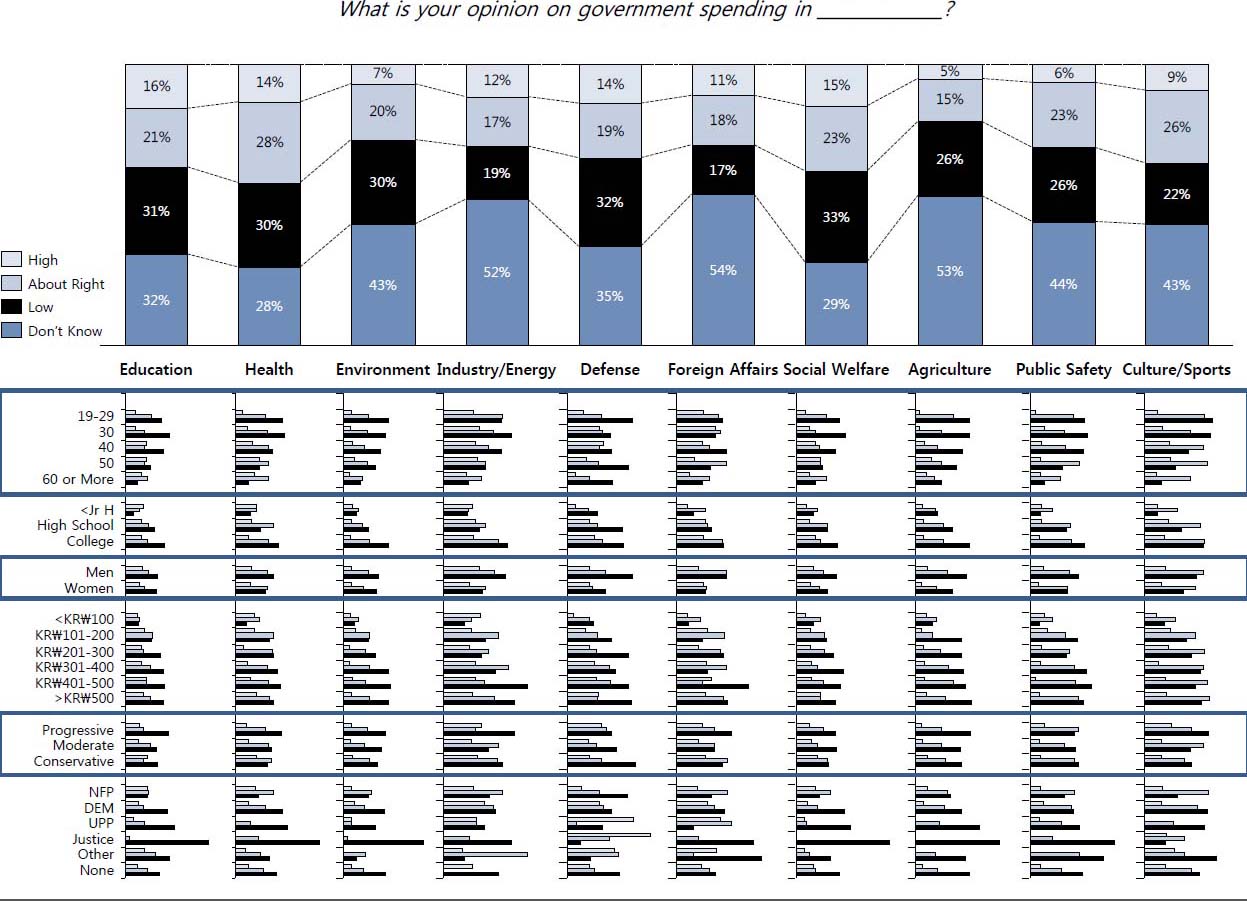
Figure 6: Attitudes Toward Spending by Category
If we delve more deeply into the specific subcategories, males, under 60s, as well as secondary and post-secondary educated respondents generally tended to perceive government spending in each area as lacking. With exception to national security and defense, progressives were more likely than moderates or conservatives to answer that government spending in each area is small. Also, respondents affiliated with a party other than that of the president tended to think that government spending is inadequate (again with exception to national security and defense).
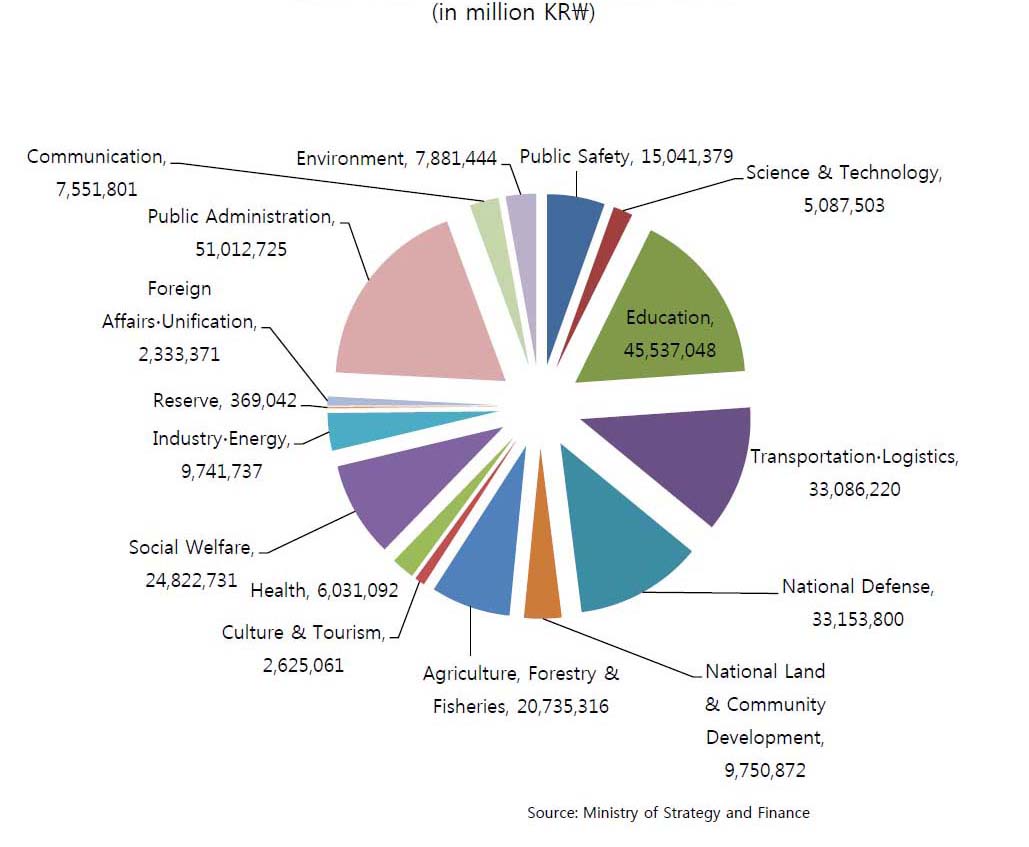
Figure 7: Total Outlay in South Korea, 2012
Finally, when we asked the respondents to broadly calculate the amount of public goods received over the past year, 49 percent responded less than KRW2.5 million, which is roughly equivalent to US$2350. 10.2 percent responded that they thought they received between KRW2.5 million and KRW5 million. This is a gross underestimation when we match this figure to the total spending in 2012, which is about KRW27.5 trillion. Per capita spending is about KRW5.5 million, which means that the majority of the respondents think that they received less public goods than the government actually doled out.
Following the Money Trail—What the Public Doesn’t Know
While studies have shown that there may be numerous demographic (i.e. income and gender) and framing effects that could be at play when it comes to public opinion on taxation,10 one factor that seems to be driving the attitudinal disposition for less taxation and spending in our study seems to be lack of adequate understanding about the government’s budget. When we asked the respondents to comment as to what they thought about the government’s budget, a significant share (40-50% or more at times) answered that they did not know enough about this subject to have an opinion (See Figure 8).
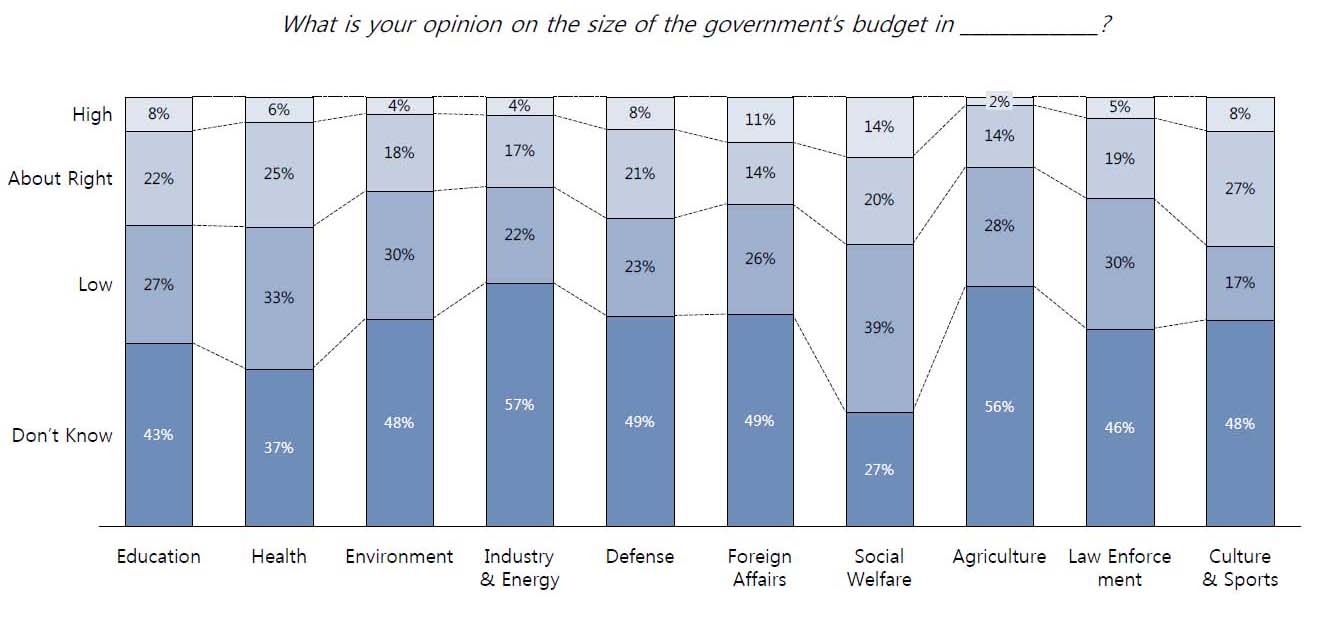
Figure 8: Attitudes Toward Budget by Category
Implications
Few people would express disinterest in the government announcement to raise or lower spending (and/or tax). Yet, what our finding suggests is that the general public is largely uninformed or even misinformed about the government’s fiscal standing and spending priorities. One way to address this problem is by looking for ways to raise civic awareness and participation through better information management and dissemination.11 An area of possible improvement is in the integration of technology and governance. Certainly, South Korea ranks high (if not highest) in terms of technological readiness and penetration of e-Governance. What is required is not simply wider penetration but a more effective and innovative integration of technology to raise transparency and participation. In this regard, the administration’s announcement of the Government 3.0 Vision Declaration and the revision of the Public Data Act as well as the Act on the Disclosure of Information by Public Institution are steps in the right direction.12 But there is still much work left in effectively implementing the Gov 3.0 initiative. If realized, an integration of a more personalized smart-web technology would prove useful in informing the public about various government services and what it costs to provide them. Secondly, the government may also want to explore whether it should consider reprioritizing its spending activities so as to better reflect public concerns. For instance, spending on culture and sports can be reduced in favor of higher spending in areas such as science and technology, energy, or even environment. Finally, the administration may also be better served by thinking about ways of improving the quality of its services without taking on increased costs. For instance, the government may consider conducting a systematic review of its current services to raise customer satisfaction. Some benchmarking for the quality of public service and continual feedback and discussion with the local community organizations could assist the officials in not only raising the overall appreciation for their work but providing better justification for their spending.
Conclusion
Expansion of social spending without tax increase is a difficult proposition. The idea may be soothing to the ears but simple arithmetic teaches us that a rise in spending will require a proportional increase in revenue unless there is a phenomenal upturn in the economy and/or the government is willing to take on more debt. The last option is likely to face some stiff opposition in the National Assembly as the administration was only able to gain a moderate increase in central government spending for the coming year due to a slight increase in public debt from 36.2 percent of GDP in 2012 to 36.5 percent in 2013. Instead of simply looking for ways to expand spending, what we recommend is a focus on transparency, better information sharing, and quality control.
At the end of the day, democratic governance is a dialectic process. Better integration of technology in information sharing can most certainly help but the process requires something more. The public must also be a wiling participant in understanding how resources are being utilized and what they can do to better contribute towards the greater good of the society as a whole. Communication with an informed public is an essential ingredient to this mix. In this regard, the Park administration is correct in its search for genuine communication. But effective communication begins at the top. As one renowned White House speechwriter James Humes once noted, “the art of communication is the language of leadership.”
The views expressed herein do not necessarily reflect the views of the Asan Institute for Policy Studies.
- 1
The authors would like to thank Kang Chungku and Han Minjeong for assistance on data collection and survey design as well as Dr. Choi Kang and Dr. Hahm Chaibong for helpful suggestions and comments.
- 2
Quote from Song Sang-ho, “Park Struggles to Shed Aloof Image,” The Korea Herald, January 6, 2014.
- 3
Kim Jong-cheol, “One year into the Park Geun-hye administration,” Hankyoreh, December 18, 2013; Editorial Opinion, “Lack of Communication,” The Korea Times, December 20, 2013.
- 4
Akrur Barua, “South Korea: Gathering Pace Despite Risks,” Asia Pacific Economic Outlook (Deloitte University Press, 2013).
- 5
Unless otherwise indicated, the data for this study were taken from the Asan Daily Poll conducted during November 26-28, December 8-10, and December 14-16 in 2013.
- 6
Harold Wilensky, Rich Democracies: Political Economy, Public Policy and Performance (Berkeley, CA: University of California Press, 2002); Jack Citrin, “Do People Want Something for Nothing: Public Opinion on Taxes and Government Spending,” National Tax Journal 32, no. 2 (1979): Supplement 113-129; Stefan Svallfors, “Government quality, egalitarianism, and attitudes to taxes and social spending: a European comparison,” European Political Science Review 5, no. 3 (2013): 363-380; Matt Moon, “How Do Americans Feel About Taxes Today?” Special Report (April 2009); Karlyn Bowman and Andrew Rugg, “Public Opinion on Taxes: 1937 to Today,” AEI Public Opinion Studies (April 2011); Benjamin I. Page and Robert Shapiro, The Rational Public: Fifty Years of Trends in Americans’ Policy Preferences (Chicago, IL: University of Chicago Press, 1992).
- 7
South Korea’s individual income tax rate is progressively tiered with earnings up to KRW12 million paying 6 percent; from KRW12 million to KRW46 million paying 16 percent; from KRW46 million to KRW88 million paying 25 percent; over KRW88 million paying 35 percent.
- 8
Richard Grant, “Less tax or more spending: twenty years of opinion polling,” Information, Analysis, and Advice for Parliament (May 2004).
- 9
This data was collected by the Asan Daily Poll during August 1-15, 2013. There are other surveys that yielded conflicting results. For instance, one poll announced by the Chosun Ilbo in August showed that approximately 54 percent of the general public is “willing to pay more taxes for the purpose of expanding social welfare.” Another survey conducted by Donga Ilbo in January 2011 suggests, however, that only 31 percent of the public “supports expanded welfare spending even if tax is increased.” The Korea Society Opinion Institute (KSOI) also announced a similar survey result in February 2006 which indicated that nearly 53 percent of the public supported increased welfare spending and taxation. These results, however, are based on a smaller sample (<1,000) and/or less reliable methods (e.g. web-based polling).
- 10
William G. Jacoby, “Issue Framing and Public Opinion on Government Spending,” American Journal of Political Science 44, no. 4 (2000): 750-767; Christopher Faricy and Christopher Ellis, “Public Attitudes Toward Social Spending in the United States: The Differences Between Direct Spending and Tax Expenditures,” Political Behavior 35, no. 1 (2013); Christopher Wlezien, “The Public as Thermostat: Dynamics of Preferences for Spending,” American Journal of Political Science 39, no. 4 (1995): 981-1000. Larry M. Bartels, “Homer Gets a Tax Cut: Inequality and Public Policy in the American Mind,” Perspectives on Politics 3, no. 1 (2005): 15-31.
- 11
Robert Putnam, Making Democracy Work: Civic Traditions in Modern Italy (Princeton, NJ: Princeton University Press, 1993); Robert Putnam, Bowling Alone: The Collapse and Revival of American Community (New York, NY: Simon & Schuster, 2000); Gabriel A. Almond and Sidney Verba, The Civic Culture: Political Attitudes and Democracy in Five Nations (Newbury Park, CA: Sage Publications, 1989).
- 12
South Korea has consistently been ranked #1 in terms of e-Government Readiness by the UN Public Administration Program in 2010 and 2012. See United Nations E-Government Survey 2012: E-Government for the People by the UN Department of Economic and Social Affairs, New York.
- 13
Hee Jung Cho and Sungsoo Hwang, Government 2.0 in Korea: Focusing on E-Participation Services (Hershey, PA: IGI Global, 2010); “Interview: Attention Centers on 2013 GeGF Forum to work out Strategies to Strengthen International Cooperation on e-Gov,” Korea IT Times, October 22, 2013; The National Information Society Agency, Concepts and Features of Government 2.0 and 3.0, March 7, 2008.