Facebook
 Twitter
Recent provocations by North Korea have prompted questionsabout the stability of the North Korean regime. The widely held view is that the recent series of provocations initiated by North Korea — the ballistic missile launch in December 2012, the third nuclear test in February 2013, and the shutdown of the Kaesong Industrial Complex in March — are borne out of desperation. It is commonly assumed that given the state of the tattered North Korean economy, the regime is simply desperate to receive more economic aid in order to ensure its long-term survival. This view is certainly reasonable given the drastic reduction in aid and trade with South Korea after 2008 and the confiscatory currency reform in November 2009. It is difficult to believe an economy as feeble as North Korea’s could have endured two major setbacks back to back, let alone one.
Figure 1. South Korean Aid to North Korea 2001-2012: Civilian and Government (in 100 Million Won)
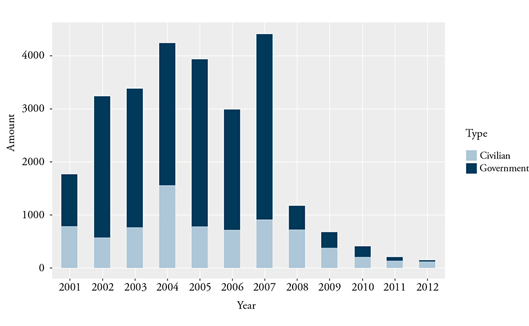
Source:The Ministry of Unification.
Yet the latest trade figures compiled by Marcus Noland at the Peterson’s Institute of International Economics (PIIE) and Steph Haggard of the University of California, San Diego show that North Korea actually recorded a trade surplus in 20121. This, in combination with the reports of increased food production (FAO/WFP 2012), and the growing number of North Koreans in the border cities of China,2 seem to contradict the commonly held view of an economy, and a regime, facing imminent collapse. There is no definite proof that the North Korean economy has finally started to improve. But the combination of evidence, especially the decade long trend in nutritional improvements and the rapid increase in trade between North Korea and China, indicates that the North Korean economy, while fragile, may have actually turned a corner.
Difficulties in Assessing the State of the North Korean Economy
The North Korean economy is largely under a veil of secrecy, as the North Korean government provides very little information to outsiders. Analyzing the state of the North Korean economy is, at best, an exercise in educated guesswork. Even the census data are reported irregularly.3 This has prompted researchers to rely on indirect indicators to assess the state of the economy. One such indirect indicator is the trade statistics of the countries that have had transactions with North Korea. Called “mirror statistics,” it uses the fact that one can in principle calculate North Korea’s total export by looking at the trade statistics of all countries that imported goods from North Korea. The same is true with the total import. The fact that North Korea is largely disconnected from the rest of the world and mainly trades with China simplifies the work.
Annual food production can also be assessed indirectly. International organizations and NGOs supplement official North Korean reports with their own assessments, which make use of climate data (average temperature, rainfall, etc), arable land extent, and soil type information, some of which is collected via satellites. On the other hand, industrial and service production is more difficult to assess. These are much harder to observe from the outside as there are relatively few indirect indicators of their production levels. The paucity of generally accepted economic indicators about the North Korean economy creates the need for non-traditional approaches to its assessment.
Malnutrition as an Economic Indicator
Usually, the nutrition level of a population is not used as an economic indicator because very low food consumption is indicative of a humanitarian crisis rather than an economic crisis. But in resource constrained countries such as North Korea, the level of food consumption can be a useful economic indicator. In poor underdeveloped economies food is an important component of the consumer basket and the fluctuation in the levels of food consumption over time can be highly correlated with changes in macroeconomic conditions.
There are a number of indicators that measure the seriousness of a food emergency. The standard measures of malnutrition are the weight-to- height ratio (acute malnutrition, “wasting”), height for age (chronic malnutrition, “stunting”), and under-weightness. These three measures focus on children under five years of age as they are most susceptible to food shortages and also most likely to suffer from the long-term consequence of malnutrition. Among these indicators, the weight- to-height ratio, or acute malnutrition, is used to gauge the short-term incidence of hunger. As height rarely changes with the short-term fluctuation in food intake, an indicator that looks at the relationship between a fairly constant quantity (height) and a highly sensitive measure (weight) can accurately capture the short-term nutrition level of the children aged five or under.
A salient feature of the acute malnutrition is the fact that the ratio of weight-to-height of the children up to the age of five is nearly the same regardless of race or sex. This makes it possible to measure how malnourished a child is given a certain height compared to a child with normal weight, using the reference statistical distribution tables compiled by the World Health Organization. If the weight of a malnourished child is more than two standard deviations away from the reference child of the same height but less than three, then the child is said to be moderately malnourished.4 When a child’s weight is more than three standard deviations away, then the child is considered to be severely malnourished. The combination of moderate and severe malnutrition is called Global Acute Malnutrition (GAM). The rule of thumb is that a food emergency is declared when the GAM prevalence is more than 15 percent. The “acceptable” threshold of the GAM prevalenceis five percent.
The use of GAM doesn’t stop at child malnutrition; it can also be a useful indicator of short-term economic fluctuation. The two necessary elements in ensuring an adequate consumption of food are the availability and accessibility of food sources. If either element proves lacking, then food insecurity will occur. Food production alone does not guarantee an adequate level of food consumption, as individuals should have consistent access to sufficient amounts of food. In this sense GAM serves as an expedient indicator of not only the food situation in the country, but also the availability and accessibility of food. An increase in GAM prevalence (i.e., a worsening food situation) would indicate deterioration in not only the food situation but also in macroeconomic conditions. The opposite (i.e., reduction in the percentage of children suffering GAM) is true when the economic situation improves. The prevalence of child malnutrition can be seen as the proverbial “canary in a mine,” especially in resource-constrained countries where income is mostly spent on essentials.
National Nutrition Surveys
The information on the nutrition status of the North Korean population comes from the surveys conducted by North Korea’s Central Bureau of Statistics with the assistance of the World Food Program (WFP) and UNICEF. The WFP first spon-sored a nutrition survey of the North Korean population in 1998.5 The WFP and UNICEF have since collected five annual nutrition surveys (2000, 2002, 2004, 2009, and 2012), with varying degrees of national coverage. This report uses the last three surveys (2004, 2009, and 2012), but the long-term trend in nutritional improvements was present before 2004.6 The survey methodology consists of teams of interviewers traveling to sampled locations across the country. At each site the survey team randomly selects children aged over zero to five whose weight and height information are recorded following the standard procedure set by the WHO.
These national surveys are administered by North Korean personnel trained by the WFP and UNICEF. There is no monitoring of potential biases when the survey team is collecting data in the field, but the WFP and UNICEF control for data quality by looking for abnormal patterns or statistical associations in the data collected. But the usual caveats should apply when it comes to interpreting data that originates from North Korea.
These surveys show that the prevalence of GAM in the whole country has steadily decreased over the past decade. In 1998, the proportion of children with GAM was 15.6 percent, but by 2012 the national average GAM fell to four percent, which is below the five percent “acceptable” threshold. This progress is especially important in light of the suspension of aid to North Korea after 2008-2009, as well as South Korea’s “5.24 Measures” implemented after the sinking of the corvette Cheonan in 2010, which cut South Korean trade with North Korea.7 Instead of suffering from food shortages because of the curtailing of aid and trade, it seems that the North Korean population is nutritionally better off than before. More importantly, the improvement took place across the country instead of being concentrated in the agriculturally productive regions, suggesting a rather broad economic improvement at all levels.
Closing the Regional Gap
One key aspect of the economic improvement in North Korea is the closing of the regional gap in nutrition, which implies a lessening of the regional economic disparity. North Korea can geographically be divided into two parts: the flat, coastal plains to the west and the mountainous regions to the east of the country. The bulk of food production takes place in the western coastal areas and the output has to be transported by rail to the east and the north. To be more precise, the grain baskets of North Korea are located in the South and North Pyeongan provinces (the capital, Pyeongyang, straddles the two) as well as the South Hwanghae province. The other provinces do not have enough arable land to be self-sufficient in food production. The level of malnutrition in the 2004 survey reflects this reality, as food consumption is on average the lowest in the northern and eastern provinces.
The geographic divide makes it especially noteworthy that the nutritional improvement has occurred across the board (Figures 2 and 3). In 2004, all but two provinces (one being the capital, Pyeongyang) had GAM prevalence level of more than five percent, the threshold of acceptability. By 2012, the situation was reversed and only two provinces, Jagang and Yanggang, had GAM prevalences above the threshold level. The largest improvement took place in North and South Hamgyeong provinces. The nutrition surveys show that the average nutrition level in these provinces has become closer to the national average during the same period.
Figure 2. GAM between 2004-2012 by Province
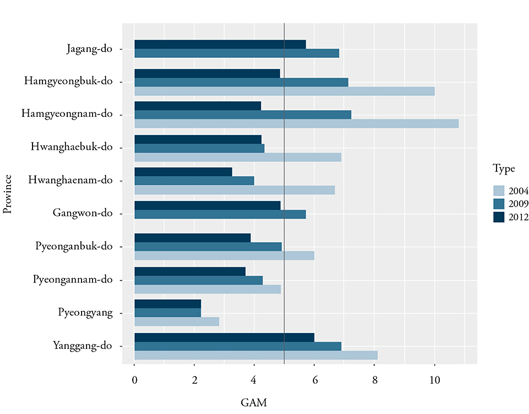
Source:Central Bureau of Statistics.
Figure 3. GAM Prevalence by Province (2004-2012)
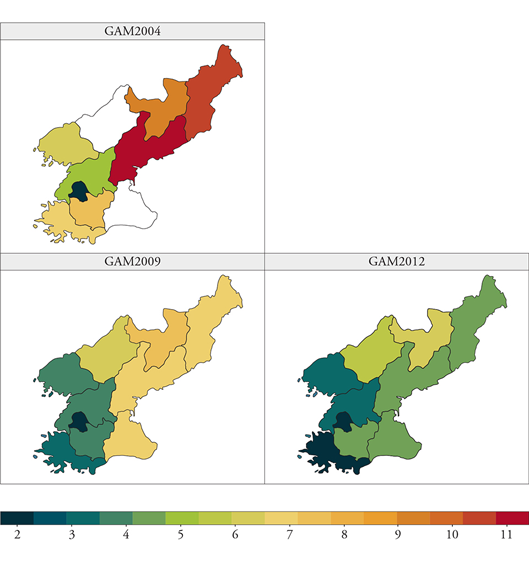
Source:Central Bureau of Statistics.
The closing of the regional gap presents the intriguing possibility that the nutritional improvement is the product of: 1) The government’s or the market’s (“Jangmadang”) success in improving the efficiency of North Korea’s dilapidated distribution system; or 2) an increase in food production, possibly through increased mechanization and/or fertilizer use. If true, then it paints a picture of the North Korean economy that is rather different from the commonly held view. More importantly, it implies an endogenously-driven economic improvement taking root.
Possible Factors behind the Economic Improvement
So what are the driving factors in these nutritional improvements? The performance is noteworthy because the progress was achieved without China making up for the shortfall in aid. According to the figures provided to the WFP, the last major food shipment from China was recorded in 2009, the same year the United States last provided food aid to North Korea. Instead, China increased its trade volume with North Korea in a dramatic manner. After 2009 the total trade between North Korea and China increased by 32 percent in 2010 and 62.4 percent in 2011. This contrasts with the average increase in trade volume between the two countries between 2005 and 2009, which stayed at around 15 percent per year.
While the increase in trade certainly made up for the decrease in aid, the composition of North Korea’s trade with China also changed qualitatively. Figure 4 shows the annual composition of top ten import items summarized into five categories excluding energy imports.8 Note that food was the top import item excluding energy (not shown) even in 2008, when North Korea was receiving considerable amounts of outside food aid. But the suspension of aid and trade with South Korea did not lead to an increase in food imports; instead, North Korea started importing more manufactured goods, automobiles, and cellphones.9 It should also be noted that North Korea increased import of fertilizers, and by 2012 similar amounts were being spent on automobiles and food imports.
Figure 4. Top Import Categories (excluding energy): North Korea
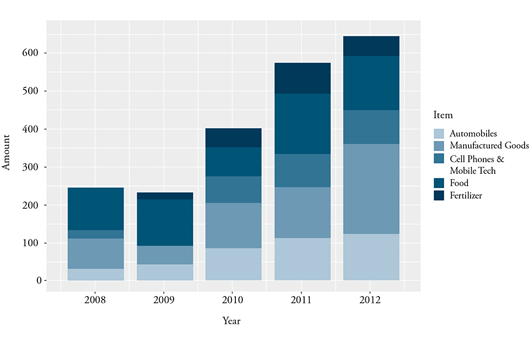
Source:KITA-Institute for International Trade.
Another positive change has been the composition of exported goods. Whereas the biggest exports are still metallic ores and minerals, more clothing and textile products are being exported to China, suggesting increased (light) manufacturing activity.10 Clothing now represents 18 percent of total export volume. In combination with the findings in the national nutrition surveys, the change in the composition of North Korea’s external trade paints a rather positive picture of its economy.
A separate FAO/WFP report on North Korea’s crop production and food security published in late 2012 also supports the conclusion of economic improvement derived from the nutrition surveys and trade data. The report indicates that the food production increased to around 4.9 million tons in 2012, which reduced the production deficit to only 207,000 tons, the lowest in years. The North Korean government reported to the FAO/WFP that the use of fertilizer increased in 2012, especially of phosphate and potash kinds. Phosphate and potash-based fertilizers help the soil stay productive for the long run, unlike the nitrogen-based fertilizers that are more commonly available but tend to acidify the soil, which leads to reduction in yield with overuse. Chinese trade data also show an increase in fertilizer imports beginning in 2008, which would partially explain some of the increase in the fertilizer input.
Implications for the Economy and Inter-Korean Relations
The nutritional improvement indicates that the population is economically better off than from an arguably very low baseline. But because vulnerable groups are first to suffer the effects of food shortages and last to see the improvements, the fact that the prevalence of GAM has been decreasing implies that proportionally more North Koreans are experiencing economic improvements than those at the bottom of the socio-economic ladder. The breadth of the recent economic improvement is also geographically broad in scope. Two of the northeastern provinces that were at the bottom in terms of children nutrition in 2004, the North Hamgyeong and South Hamgyeong, are the ones that have seen the biggest improvements by 2012. These developments imply that the economic improvement is not benefiting the elites in Pyeongyang at the expense of the rest of the country, but have benefited a broad swath of society.
The Chinese trade data shows that the North Korean economy is not only changing in terms of quantity, but in quality as well. The composition of imported items is more sophisticated and diverse than before South Korea and the United States cut aid and trade in 2008-2009. North Korea is using more and better fertilizers than before 2008-2009,11 which might have resulted in increased food production. If the curtailing of aid and trade after the 2008-2009 period was the biggest negative external shock to the North Korean economy, the sudden explosion of trade with China has certainly made up for it, judging from the national nutrition surveys since 2009 and the 2012 FAO/WFP report.
Evidently, the North Korean economy has benefited greatly from trade with China, yet has also grown dependent on it. So, why did inter- Korean trade, which was more substantial for a longer period compared that with China, not have the same effect? The answer lies with the nature of the Kaesong Industrial Complex (KIC).
While inter-Korean trade has been substantial since the ‘00s, the export of components and import of assembled goods to and from the KIC represented almost all inter-Korean trade since 2008. It totaled two billion US dollars in 2012 and 1.7 billion in 2011. However, the KIC is by design incapable of influencing the North Korean economy as North Korea only supplies labor to the KIC. A South Korean firm prepared the groundwork and laid the basic infrastructure, and even food is imported from South Korea. North Korea could have just as well decided to bus the North Korean workers across the Demilitarized Zone (DMZ) and bring them back every day, as the net effect on the North Korean economy would have been almost the same. In sum, the KIC only generated income for the North Korean state without much positive externality for the economy, as the workers received wages in North Korean Won that the state had collected from their South Korean employers in US dollars. The state was successful in mopping up any kind of surplus that could have gone into the private sector to stimulate private demand.
Having decided to minimize possible dependence on the South Korean economy, the North Korean regime has apparently cast its lot with the growing Chinese economy. The recent economic improvement and the economy’s growing dependence on China go hand in hand. Integrating the North Korean economy into South Korea’s through economic development was what the previous progressive
South Korean administrations hoped to achieve with the “Sunshine Policy.” It remains to be seen whether China might succeed where South Korea failed.
References:
- Central Bureau of Statistics, Institute of Child Nutrition, & Democratic People’s Republic of Korea. (2005). DPRK 2004 nutrition assessment report of survey results.
- Central Bureau of Statistics and United Nations Children’s Fund. (2010). Democratic People’s Republic of Korea multiple indicator cluster survey 2009.
- Central Bureau of Statistics (2012). Democratic People’s Republic of Korea preliminary report of the national nutrition survey 2012.
- Food and Agriculture Organization of the United Nations and World Food Programme (2012). FAO/WFP crop and food security assessment mission to the Democratic People’s Republic of Korea. Rome: FAO and WFP.
- Hamill, P. V. V., et al. “NCHS growth charts for children, birth-18 years.” United States. Vital Health Statistics. Series 11 (1977).
- Institute for International Trade. (2011). 2010 trends in North Korea-South Korea and North Korea-China trades (Korean).
- Institute for International Trade. (2012). 2011 trends in North Korea-South Korea and North Korea-China trades (Korean).
- Institute for International Trade. (2013). 2012 trends in North Korea-South Korea and North Korea-China trades (Korean).
- Ministry of Unification. (n.d.). South Korea government aid to North Korea & South Korean aid to North Korea (Korean).
- Reinhard, I. & Wijayaratne, K.B.S. (2002). The use of stunting and wasting as indicators for food insecurity and poverty (Working Paper 27). Trincomalee: Integrated Food Security Programme.
- Setboonsarng, S. (2005). Child malnutrition as a poverty indicator: An evaluation in the context of different development interventions in Indonesia (ADB Institute Discussion Paper No. 21). Manila: ADB.
The views expressed herein do not necessarily reflect the views of the Asan Institute for Policy Studies.
-
1
“Hugely important: North Korea running a current account surplus?” PIIE blog, Accessed May 25th. http://www.piie.com/blogs/nk/?p=9647.
-
2
“Number of N. Korean visitors to China up 14 pct in Q1” Yonhap News, Accessed May 27th http://english.yonhapnews.co.kr/northkorea/2013/04/26/98/0401000000AEN20130426004600315F.HTML.
-
3
The last census report was in 2008; it was the first census reported to the UN since 1993.
-
4
The deviation is in the negative direction, that is, underweight.
-
5
1998, 2000, and 2009 surveys are called MICS or Multiple Indicator Cluster Surveys, which mainly denotes the technical aspect of the sampling design; 2002 and 2004 surveys are called DPRK Nutrition Assessments; finally, the 2012 survey is called National Nutrition Survey.
-
6
The reason for restricting the surveys to 2004-2012 is to illustrate the before and after effect of curtailing of the aid in 2008/9.
-
7
Kaesong Industrial Complex was not affected by the measures.
-
8
China applies market price to its oil exports to North Korea, which is highly variable year to year, but the quantity exported annually is kept at around 500,000 tons.
-
9
Most were intermediate manufactured goods for reprocessing and re-export to China
-
10
The amount of textile products exported to China more than doubled from 190 million USD in 2010 to 453 million USD in 2012 (Institute for International Trade 2012).
-
11
Phosphate and potash kinds.